Why should you bet on corners?
Betting on soccer corners has become increasingly popular in recent years. In addition to offering bettors the opportunity to take advantage of the bookmaker’s lack of knowledge or attention to small details, the fluctuation of odds in live corner betting is another reason sharp bettors choose this particular market.
Betting on soccer corners differs significantly from other markets, such as 1X2 or Handicap. Match outcome links to the number of corners for each side, but this is only sometimes the case. Because soccer is a low-scoring sport, draws and underdog wins are easier to come by than in other sports. However, the corner count will be higher and more accurately reflect a team’s performance.
Although goals are rare events, an average match features between 10 & 11 corners, and while odd outcomes can and do occur (e.g., the massive underdog game-winning), the count corner is more likely to go as expected.
In the five seasons of soccer Premier League 2016/17 and 2020/21, 1,057 out of 1,900 matches (55.6%) win by the Favorite, but 1,208 (63.6%) saw the Favorite also have the most corners.
Although it is impossible to have straight betting on which side will win the corners in a match, the widely available data can establish the probability of a successful Bet in the general markets.
How to bet on corners
Pinnacle offers two corner betting markets in major European football leagues and the UEFA Champions League – totals and handicaps.
Total betting corner Explanation
In this market, the bookmaker sets what they believe will be the total number of corners in the match, and bettors can choose whether to bet over or under that figure.
Example of a total corner bet:
Wolves vs. Arsenal, February 10, 2022
More than ten corners (11 or more corners): 1.909
Under ten corners (nine or fewer corners): 1.917
Wolves have averaged 10.0 corners per game before kick-off this season, while Arsenal has 10.3, so the bookmaker’s pick is logical, leaving bettors with a difficult decision. With 11 corners as the game went on, the line was well chosen, and the result could quickly have gone either way.
But as we’ll see later, there are a few things that can guide our betting choices for this market.
What is betting on Handicap corners?
It follows the same format as any other type of handicap betting, with one side gaining an advantage to balance the disadvantage they may hold in reality, & vice versa, with the other offering different options and odds.
Example handicap betting for Wolves v Arsenal two games:
Balloon +0.5 corners: 1.961
Arsenal -0.5 Corners: 1.869
In this example, betting on Arsenal would require them to have at least one more corner than the Wolves. If you back the Wolves, your bet will win if they have at least as corners as the Gunners.
Arsenal’s average corner dissimilarity per game in 2021/22 was 0.4 before this match, and the Wolves’ was -1.5, so their records advise that a bet on Arsenal was the right choice.
But the Wolves bet proved successful, as they had seven corners while Arsenal had four. We will see why this anxiety occurs later when we consider the relevance of the game state.
Corners betting analysis
A corner in soccer can come from a variety of situations. It accepts that corners come in clusters, but this- does not mean that one corner will be followed by one more, just that corners can come in bursts of 2, three, or more in a row.
If you understand how to bet on corners, you must determine which teams expect to win corners and which are more likely to concede.
Shots are a Big contributor in terms of winning corners – a high number of shots indicates an attacking advantage, and they tend to be deflected, which can lead to corners.
The table below shows the average number of shots per game by Premier League teams, covering the 2014/15 to 2018/19 seasons:
| – | 2014/15 | 2015/16 | 2016/17 | 2017/18 | 2018/19 | Average |
| Manchester City | 17.60 | 16.20 | 16.70 | 17.50 | 18.00 | 17.20 |
| Liverpool | 15.50 | 16.60 | 16.80 | 16.80 | 15.10 | 16.16 |
| Tottenham Hotspur | 13.90 | 17.30 | 17.60 | 16.40 | 14.10 | 15.86 |
| Chelsea | 14.80 | 13.80 | 15.30 | 15.90 | 16.00 | 15.16 |
| Arsenal | 16.10 | 15.10 | 14.90 | 15.60 | 12.30 | 14.80 |
| Manchester United | 13.50 | 11.30 | 15.60 | 13.50 | 13.80 | 13.54 |
| Southampton | 13.40 | 13.70 | 14.50 | 11.80 | 12.70 | 13.22 |
| Wolverhampton Wanderers | – | – | – | – | 12.60 | 12.60 |
| West Ham United | 12.90 | 14.70 | 13.10 | 9.80 | 11.60 | 12.42 |
| Leicester City | 12.00 | 13.70 | 11.40 | 11.10 | 13.60 | 12.36 |
| Everton | 12.70 | 12.90 | 13.20 | 9.40 | 13.10 | 12.26 |
| Crystal Palace | 11.60 | 12.30 | 11.60 | 12.50 | 13.00 | 12.20 |
| Bournemouth | – | 12.20 | 11.90 | 12.20 | 11.70 | 12.00 |
| Fulham | – | – | – | – | 11.90 | 11.90 |
| Newcastle United | 12.30 | 10.40 | – | 11.90 | 11.70 | 11.58 |
| Watford | – | 11.70 | 11.10 | 11.60 | 11.50 | 11.48 |
| Cardiff City | – | – | – | – | 11.00 | 11.00 |
| Burnley | 11.30 | – | 10.30 | 9.90 | 9.50 | 10.25 |
| Huddersfield Town | – | – | – | 9.50 | 10.60 | 10.05 |
| Brighton & Hove Albion | – | – | – | 10.10 | 9.80 | 9.95 |
When comparing this to the table of average corners per game over the same period, the link between shots and corners quickly becomes apparent:
| – | 2014/15 | 2015/16 | 2016/17 | 2017/18 | 2018/19 | Average |
| Manchester City | 7.18 | 6.76 | 7.37 | 7.47 | 7.55 | 7.27 |
| Liverpool | 5.21 | 6.97 | 6.55 | 6.05 | 6.55 | 6.27 |
| Tottenham Hotspur | 5.89 | 6.68 | 7.18 | 6.47 | 5.11 | 6.27 |
| Arsenal | 6.68 | 5.97 | 5.97 | 5.87 | 5.58 | 6.01 |
| Chelsea | 5.95 | 6.32 | 5.74 | 6.05 | 5.53 | 5.92 |
| Manchester United | 5.61 | 6.00 | 5.71 | 5.79 | 5.26 | 5.67 |
| Southampton | 5.50 | 5.89 | 5.26 | 5.97 | 5.08 | 5.54 |
| Crystal Palace | 5.50 | 5.76 | 5.32 | 5.50 | 5.39 | 5.49 |
| Bournemouth | – | 5.82 | 5.03 | 5.71 | 5.03 | 5.40 |
| Leicester City | 5.55 | 5.18 | 5.18 | 5.34 | 5.53 | 5.36 |
| West Ham United | 6.34 | 5.89 | 4.53 | 4.24 | 4.92 | 5.18 |
| Wolverhampton Wanderers | – | – | – | – | 5.13 | 5.13 |
| Everton | 5.11 | 5.74 | 5.16 | 3.95 | 5.66 | 5.12 |
| Newcastle United | 5.84 | 4.16 | – | 4.39 | 4.76 | 4.79 |
| Watford | – | 4.37 | 4.32 | 4.84 | 4.66 | 4.55 |
| Cardiff City | – | – | – | – | 4.42 | 4.42 |
| Huddersfield Town | – | – | – | 4.34 | 4.26 | 4.30 |
| Fulham | – | – | – | – | 4.24 | 4.24 |
| Brighton & Hove Albion | – | – | – | 4.29 | 4.11 | 4.20 |
| Burnley | 4.47 | – | 3.92 | 4.39 | 3.92 | 4.18 |
A similar approach uses when looking at who is most likely to concede a corner in a match. The number of goals conceded and the number of shots & crosses blocked per game highlight which teams are under more pressure and are likely to recognize corners.
The table below shows the average number of goals conceded by each Premier League team, as well as the number of blocks and crosses each team scored per game:
| – | 2014/15 | 2015/16 | 2016/17 | 2017/18 | 2018/19 | Average |
| Manchester City | 10.20 | 8.90 | 7.90 | 6.20 | 6.30 | 7.90 |
| Liverpool | 10.90 | 10.50 | 8.20 | 7.40 | 8.10 | 9.02 |
| Chelsea | 10.90 | 12.70 | 8.50 | 9.90 | 9.20 | 10.24 |
| Tottenham Hotspur | 12.90 | 11.10 | 9.20 | 9.40 | 12.10 | 10.94 |
| Manchester United | 10.10 | 10.80 | 9.50 | 11.50 | 13.10 | 11.00 |
| Arsenal | 10.70 | 11.80 | 11.40 | 11.10 | 13.10 | 11.62 |
| Southampton | 10.10 | 12.20 | 11.50 | 12.90 | 13.70 | 12.08 |
| Wolverhampton Wanderers | – | – | – | – | 12.20 | 12.20 |
| Huddersfield Town | – | – | – | 11.60 | 13.70 | 12.65 |
| Watford | – | 13.20 | 14.20 | 10.90 | 12.90 | 12.80 |
| Everton | 13.20 | 14.60 | 11.80 | 14.20 | 10.60 | 12.88 |
| Newcastle United | 11.70 | 14.50 | – | 12.60 | 12.90 | 12.93 |
| Leicester City | 14.70 | 13.60 | 14.60 | 12.90 | 11.20 | 13.40 |
| Bournemouth | – | 11.60 | 14.50 | 14.40 | 13.70 | 13.55 |
| Crystal Palace | 13.80 | 14.90 | 13.60 | 12.30 | 13.80 | 13.68 |
| West Ham United | 15.50 | 13.70 | 13.30 | 14.80 | 13.90 | 14.24 |
| Brighton & Hove Albion | – | – | – | 14.60 | 15.30 | 14.95 |
| Cardiff City | – | – | – | – | 15.00 | 15.00 |
| Fulham | – | – | – | – | 15.40 | 15.40 |
| Burnley | 15.60 | – | 17.70 | 15.00 | 17.20 | 16.38 |
| – | 2014/15 | 2015/16 | 2016/17 | 2017/18 | 2018/19 | Average |
| Manchester City | 5.00 | 3.90 | 3.50 | 2.60 | 2.60 | 3.52 |
| Liverpool | 5.10 | 5.30 | 4.00 | 3.80 | 3.40 | 4.32 |
| Chelsea | 5.30 | 6.20 | 4.50 | 5.00 | 3.60 | 4.92 |
| Tottenham Hotspur | 6.50 | 6.30 | 4.40 | 3.80 | 4.90 | 5.18 |
| Manchester United | 4.80 | 4.40 | 4.80 | 5.00 | 5.30 | 4.86 |
| Arsenal | 5.10 | 6.00 | 4.80 | 4.70 | 4.50 | 5.02 |
| Southampton | 5.60 | 6.80 | 6.00 | 5.90 | 6.10 | 6.08 |
| Wolverhampton Wanderers | – | – | – | – | 6.00 | 6.00 |
| Huddersfield Town | – | – | – | 5.30 | 4.70 | 5.00 |
| Watford | – | 6.40 | 6.70 | 4.50 | 5.20 | 5.70 |
| Everton | 8.40 | 8.10 | 6.40 | 6.90 | 3.90 | 6.74 |
| Newcastle United | 5.40 | 7.20 | – | 6.00 | 6.10 | 6.18 |
| Leicester City | 7.70 | 8.80 | 7.00 | 6.30 | 5.20 | 7.00 |
| Bournemouth | – | 5.10 | 6.80 | 7.10 | 6.20 | 6.30 |
| Crystal Palace | 6.90 | 7.30 | 5.90 | 5.70 | 6.20 | 6.40 |
| West Ham United | 7.70 | 7.20 | 5.80 | 6.70 | 6.00 | 6.68 |
| Brighton & Hove Albion | – | – | – | 7.90 | 6.80 | 7.35 |
| Cardiff City | – | – | – | – | 5.60 | 5.60 |
| Fulham | – | – | – | – | 6.10 | 6.10 |
| Burnley | 8.30 | – | 9.10 | 8.50 | 8.10 | 8.50 |
| – | 2014/15 | 2015/16 | 2016/17 | 2017/18 | 2018/19 | Average |
| Manchester City | 4.08 | 4.34 | 3.42 | 2.71 | 2.16 | 3.34 |
| Liverpool | 5.24 | 4.61 | 3.50 | 3.32 | 3.32 | 4.00 |
| Manchester United | 4.53 | 3.79 | 3.89 | 4.61 | 4.89 | 4.34 |
| Chelsea | 4.29 | 5.42 | 4.21 | 4.18 | 3.95 | 4.41 |
| Tottenham Hotspur | 5.53 | 4.76 | 3.58 | 4.21 | 4.92 | 4.60 |
| Arsenal | 4.53 | 4.76 | 5.03 | 4.71 | 4.84 | 4.77 |
| Huddersfield Town | – | – | – | 5.50 | 4.47 | 4.99 |
| Wolverhampton Wanderers | – | – | – | – | 5.00 | 5.00 |
| Southampton | 4.26 | 5.89 | 5.00 | 5.29 | 5.61 | 5.21 |
| West Ham United | 5.55 | 5.16 | 4.84 | 5.47 | 5.50 | 5.30 |
| Bournemouth | – | 4.45 | 5.39 | 5.53 | 5.92 | 5.32 |
| Watford | – | 6.42 | 5.32 | 5.21 | 5.53 | 5.62 |
| Everton | 5.32 | 5.97 | 5.66 | 5.58 | 5.66 | 5.64 |
| Crystal Palace | 5.95 | 5.84 | 5.87 | 5.50 | 5.68 | 5.77 |
| Newcastle United | 4.82 | 6.37 | – | 5.87 | 6.08 | 5.79 |
| Brighton & Hove Albion | – | – | – | 6.00 | 5.68 | 5.84 |
| Leicester City | 6.16 | 6.29 | 5.76 | 5.68 | 5.32 | 5.84 |
| Fulham | – | – | – | – | 5.95 | 5.95 |
| Burnley | 6.32 | – | 6.92 | 6.32 | 6.32 | 6.47 |
| Cardiff City | – | – | – | – | 6.84 | 6.84 |
Betting analysis on recent corners – using data to support your betting on corners
The result of a match can be related to the number of corners for each side, but only sometimes. But what about the correlation with one goal scored & corners won & goals conceded and corners conceded?
If we look at the ten top-scoring sides from Premier League soccer’s last five full seasons, we can see that eight are also in the top 10 for corners in that period.
| Season | Team | League Position | Goals Scored | Corners | Corner Rank |
| 2017/18 | Manchester City | 1 | 106 | 284 | 3 |
| 2019/20 | Manchester City | 2 | 102 | 298 | 1 |
| 2018/19 | Manchester City | 1 | 95 | 287 | 2 |
| 2018/19 | Liverpool | 2 | 89 | 249 | 8 |
| 2016/17 | Tottenham | 2 | 86 | 273 | 5 |
| 2019/20 | Liverpool | 1 | 85 | 258 | 7 |
| 2016/17 | Chelsea | 1 | 85 | 218 | 24 |
| 2017/18 | Liverpool | 4 | 84 | 230 | 15 |
| 2020/21 | Manchester City | 1 | 83 | 247 | 10 |
| 2016/17 | Manchester City | 3 | 80 | 280 | 4 |
Spearman’s rank correlation coefficient gave the Goals and Corners data a score of 0.761 (where 1 is perfectly correlated and 0 is not).
The link at the other end of the pitch is not as strong (0.662), but there are still plenty of teams conceding the most corners to the team with the most goals.
| Season | Team | League Position | Goals Conceded | Corners Conceded | Corner Rank |
| 2018/19 | Fulham | 19 | 81 | 226 | 24 |
| 2016/17 | Hull | 18 | 80 | 243 | 11 |
| 2020/21 | West Brom | 19 | 76 | 267 | 2 |
| 2018/19 | Huddersfield | 20 | 76 | 170 | 78 |
| 2019/20 | Norwich | 20 | 75 | 266 | 3 |
| 2018/19 | Bournemouth | 14 | 70 | 225 | 25 |
| 2016/17 | Swansea | 15 | 70 | 186 | 64 |
| 2018/19 | Cardiff | 18 | 69 | 260 | 5 |
| 2016/17 | Sunderland | 20 | 69 | 248 | 9 |
| 2017/18 | Stoke | 19 | 68 | 281 | 1 |
| 2018/19 | Burnley | 15 | 68 | 245 | 10 |
| 2017/18 | West Ham | 13 | 68 | 208 | 46 |
| 2016/17 | Watford | 17 | 68 | 202 | 50 |
| 2020/21 | Southampton | 15 | 68 | 197 | 56 |
The statistics above are for teams in a given season, but if we look at the 12 teams in the Premier League continuously between 2016 and 2021, we can see a clear link between their shots, goal, and corner statistics for the season a whole.
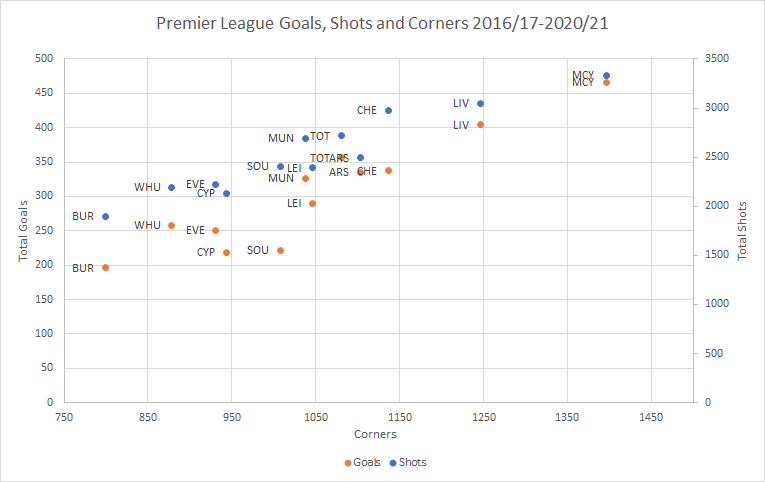
While data on corners is easy to come by, even a team’s standing in the goals scored & conceded column can give us a fundamental but valuable insight into the corners betting market.
House advantage in betting corners
Home-field advantage is a huge consideration in sports betting, and it certainly applies when placing bets on corner soccer markets.
The average side, Premier League, has had 4.7 corners per match on the road but 5.7 in front of their supporters.
In 100 team seasons (20 teams over five seasons), only 11 featured corners in away games, and only one (Hull City in 2016/17) averaged at least 1 per match.
However, the stronger team often wins in terms of corners, regardless of the venue. 54% of Premier League matches over the past five years have seen the home side victory the corner count, but the away side has the advantage in 38% of matches.
Match the odds of the winner
An important thing to remember when betting on corners in soccer is that it is not as simple as the favorite to win the match betting on who will win the corners, nor is the team that wins the most corners the most likely to win the game. Continuing with the Premier League sample above, less than 3% of corners were converted into goals from the start of 2012/13 to 2018/19, so corner totals have a limited impact on match results.
Betting on gaming corners: the importance of game state
It is very important to consider the state of the game if you are betting on corners during a game (known as live or in-play corner betting). You might expect a team to comfortably cover their handicap in corners or contribute most of the corner count. Still, if that team takes an early lead, they may sit or commit fewer players to forward, making them less likely to get more corners.
If a team is chasing the match, they will be more inclined to carry out people forward, take more shots & put more balls in the box – two things we know can result in more corners. If you’re betting on corners during a match, it’s more complex than applying your pre-match research to the available markets, and you need to think about what has or has not happened and how it will affect how the game plays out. Two teams left of the fight.
Corner betting tactics
While we’ve seen the link in the middle of shots and corners, we must also consider team tactics. Teams that rely on crosses to get the ball into the box usually have a lot of corners because their crosses can be cleared or blocked.
At the time of writing, Brighton is 10th in the 2021/22 Premier League for shots per game but sixth for crosses per game. The Seagulls rank seventh in corners per game, so in their case, wide passes seem to have more of an effect on their corner totals than shots on goal.
Total Corners betting strategy
It may not be enough to look at how many corners each team match has averaged when you place a bet on the Total Corners market, as that is a good starting point.
There are always unusual teams to watch out for. In 2019/20, just two of the Wolves’ 19 home games featured more than 10.5 corners, the fewest of any team in the previous 5 seasons. But 10 of their away matches reach that benchmark when the maximum for either side between 2016/17 & 2020/21 was 13 such games.